April 20th, 2026
Financial Analysis in Debriefing
We've added a Financial Recap to Supply Chain simulation debriefings, and a new Waterfall view to the Lean Game's existing Financial Statement.
Supply Chain: Financial Recap
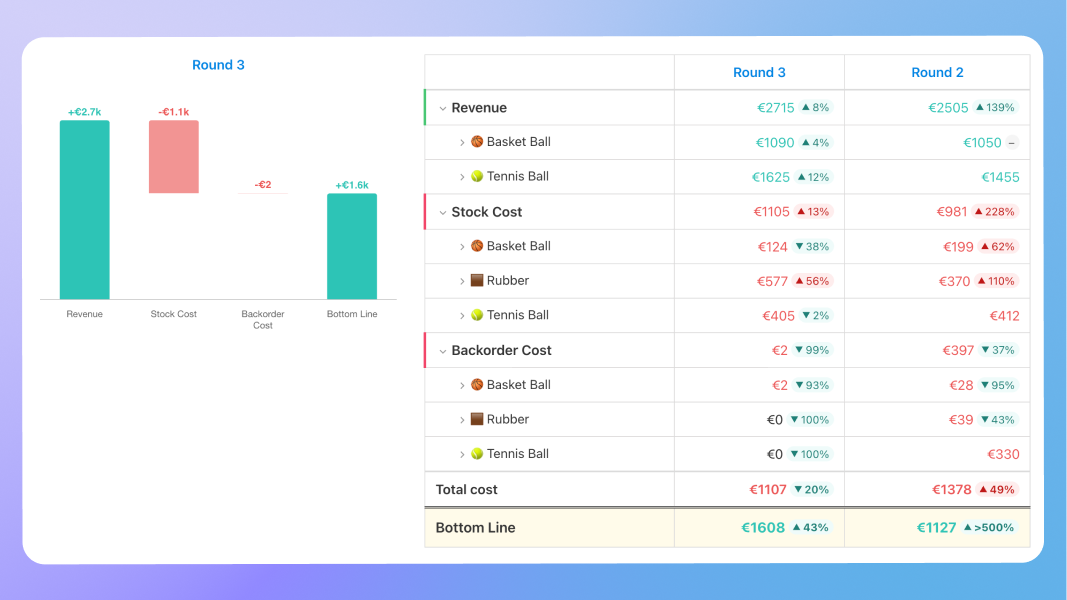
Supply Chain game debriefings now include a full P&L breakdown showing revenue and costs — with drill-down by product and by site.
On the player debriefing page, the Financial Recap can be displayed with two views side by side: a waterfall chart showing the P&L shape at a glance, and a detailed table. Each row is expandable by product (Ex: Tennis Ball, Basket Ball…), then by site (Retailer, Factory…).
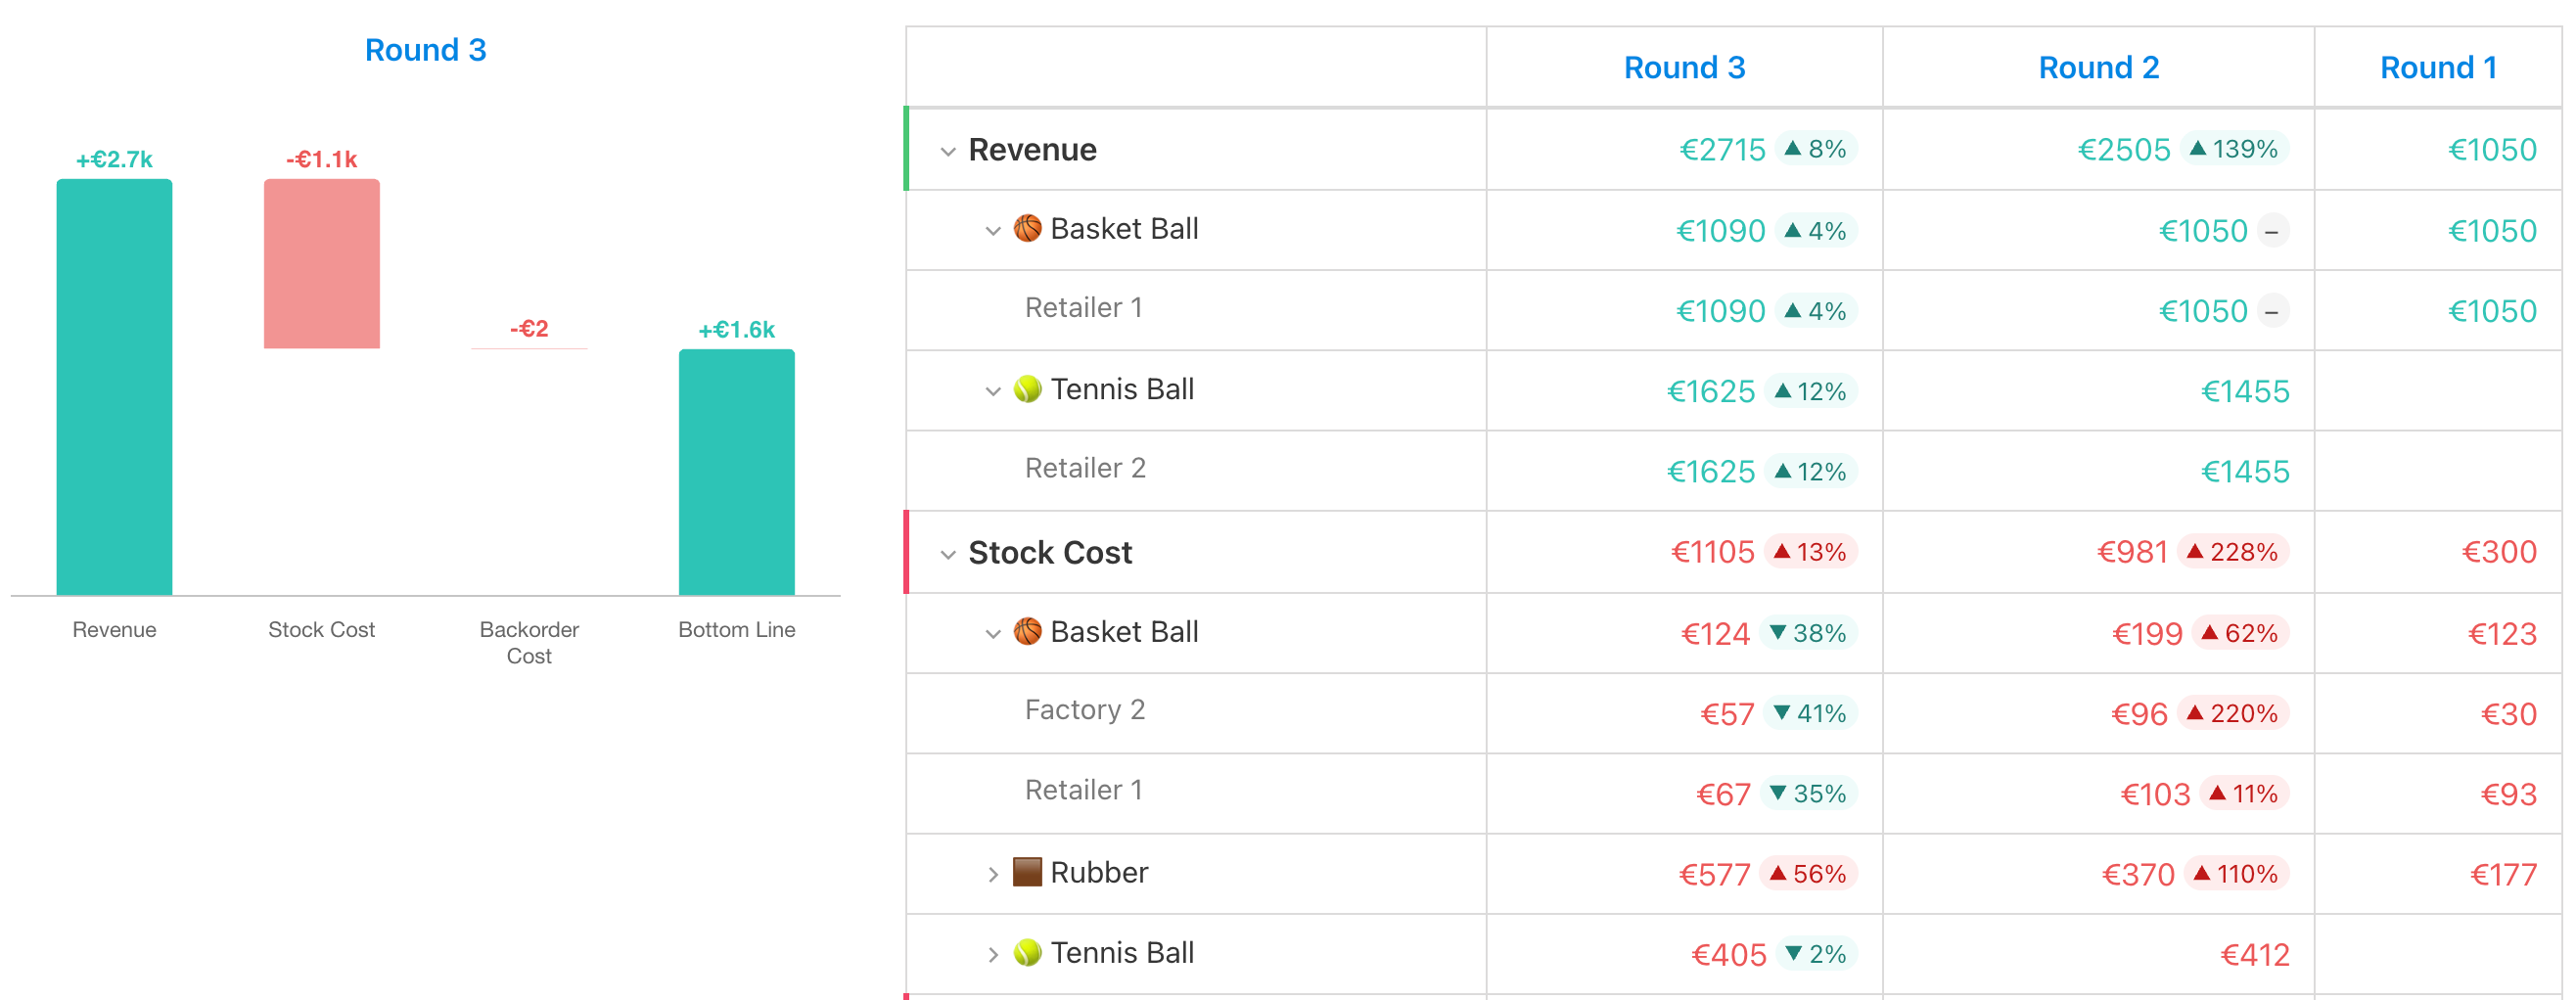
The Financial Recap also appears on the Session Results page, so instructors can compare the financial profile of all teams. Switch between Waterfall and Table view depending on whether you want pattern recognition or precise numbers.
The waterfall makes it easy to spot at a glance which teams had a revenue problem vs. a cost problem — and whether their costs were driven by overstocking, backorders, or other.
How to activate
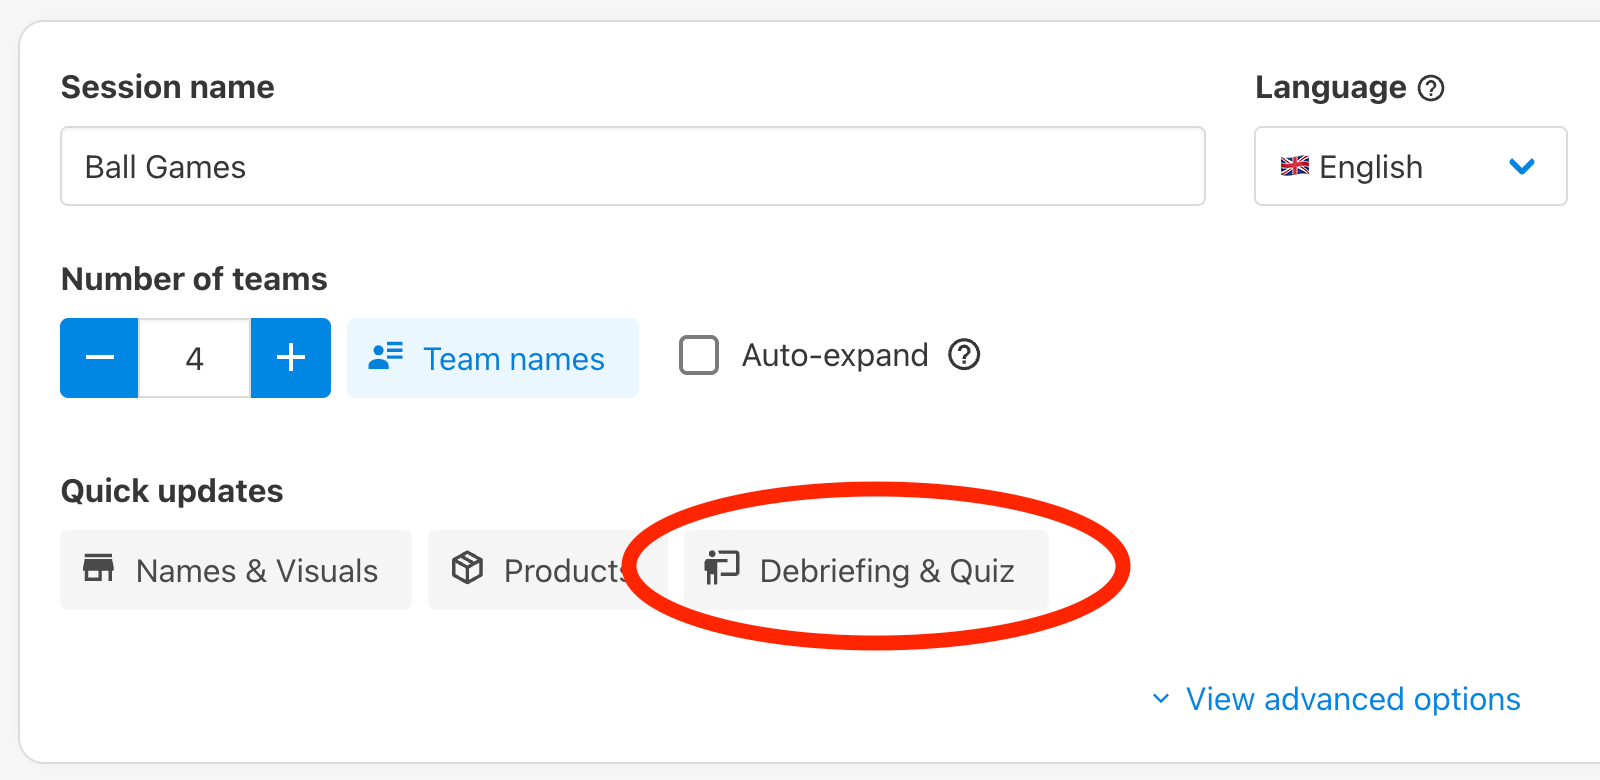
The new player/session financial views are only active when you have Revenue setup in a game (via unit prices at a site). You can toggle them via the Debriefing settings:
Lean Game: Waterfall view
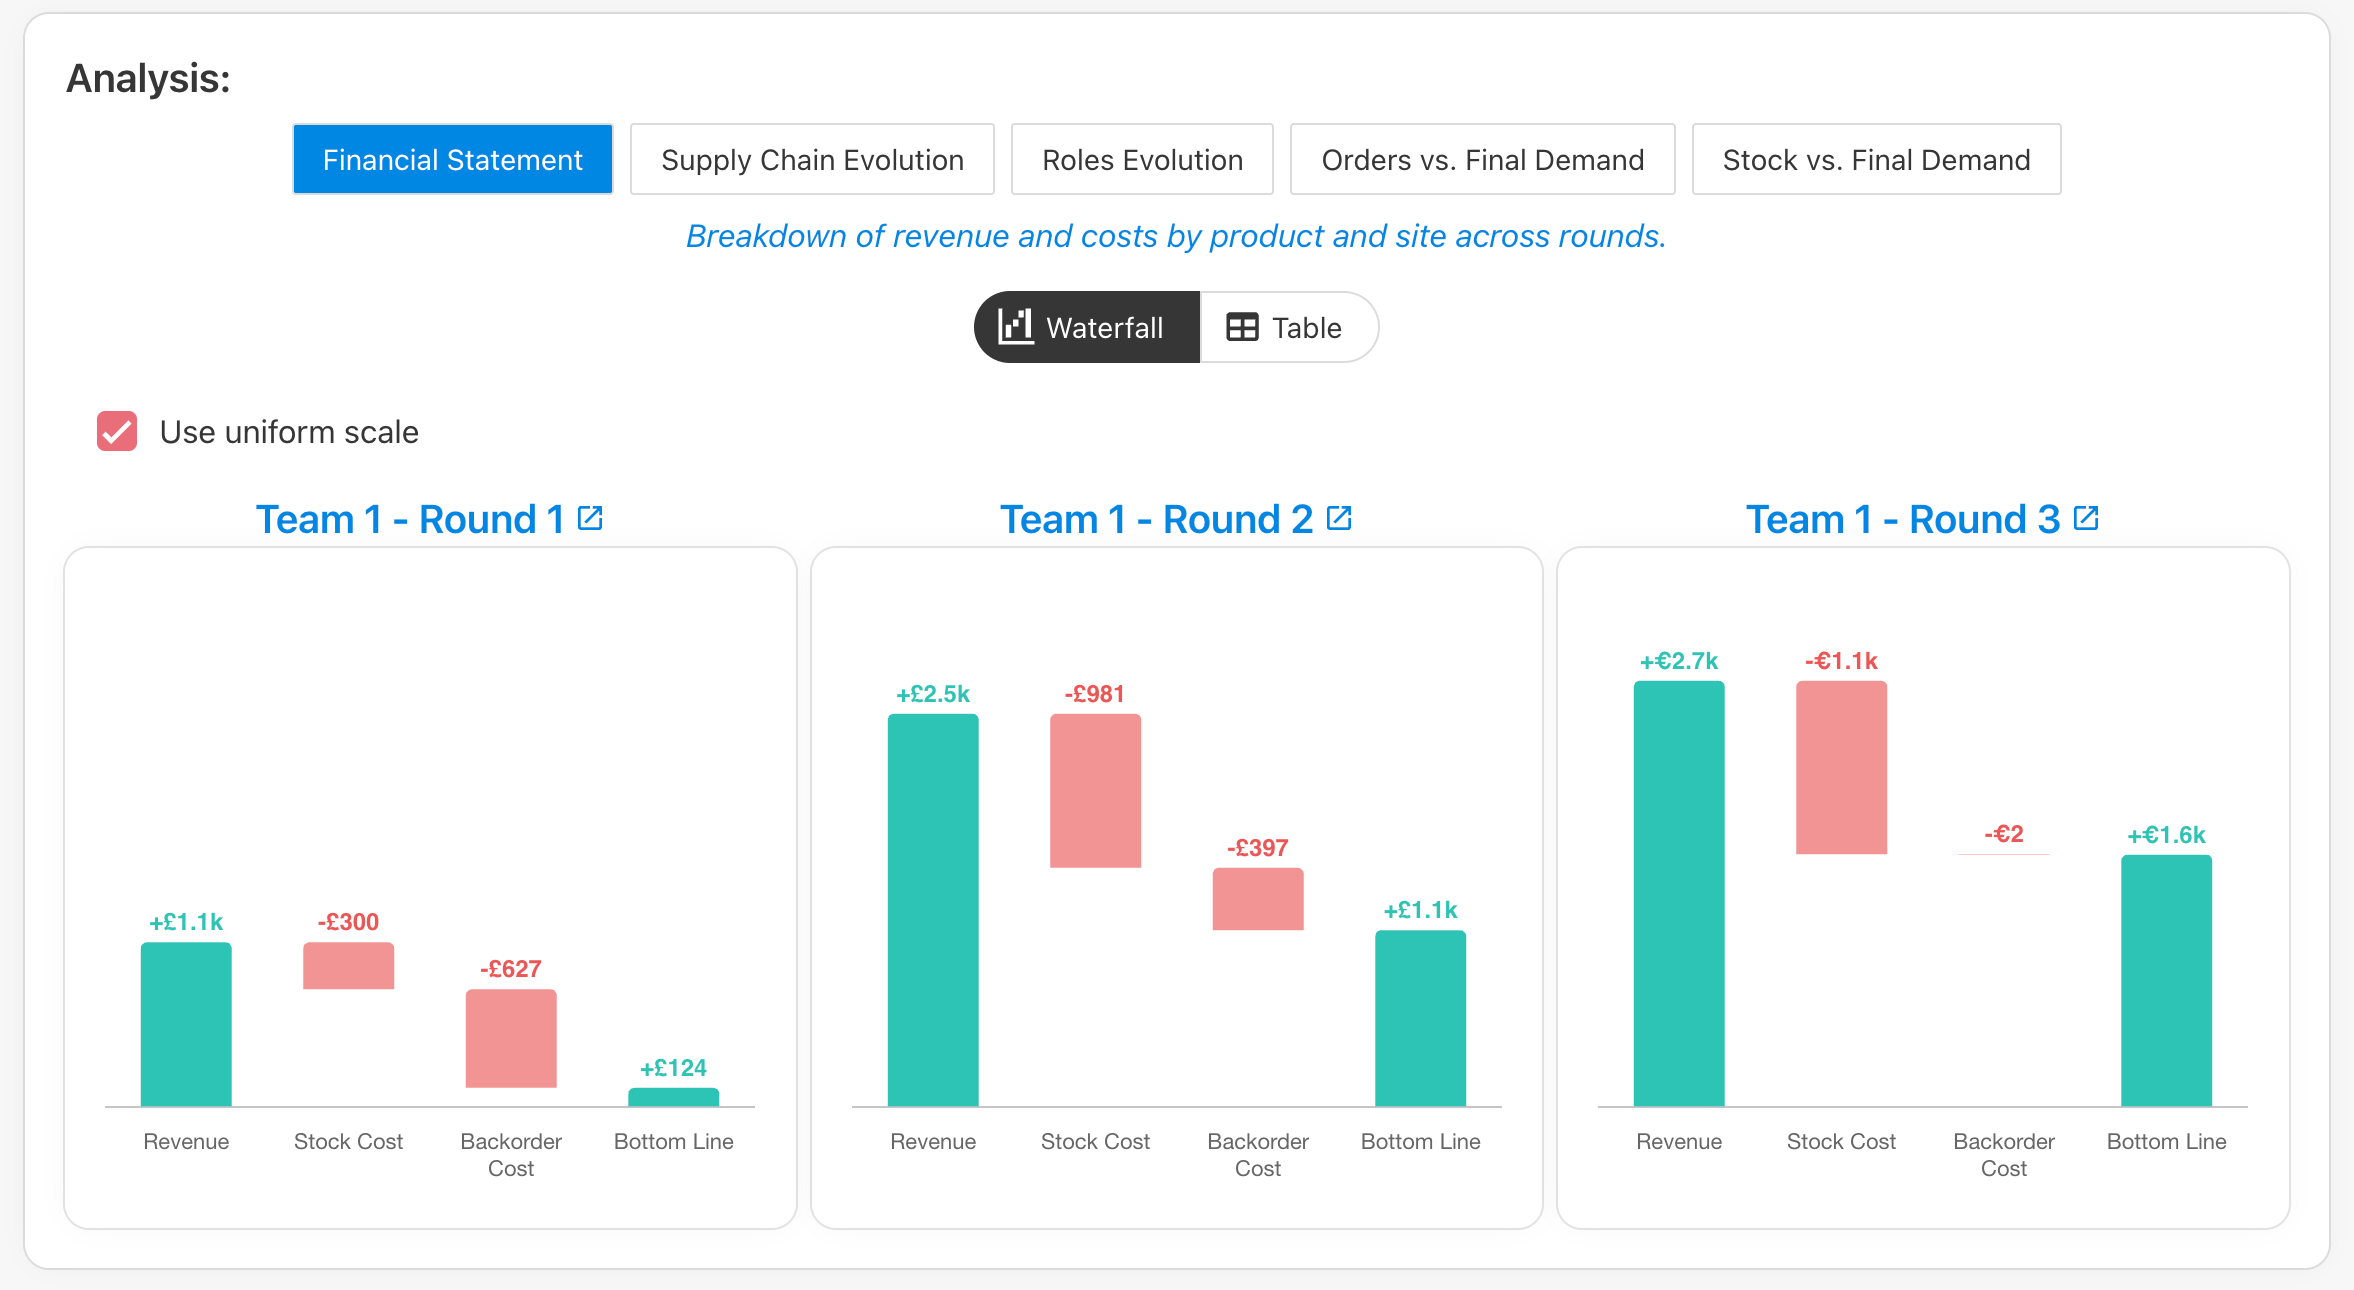
The Lean Game's Financial Statement now supports a Waterfall view alongside the existing table.
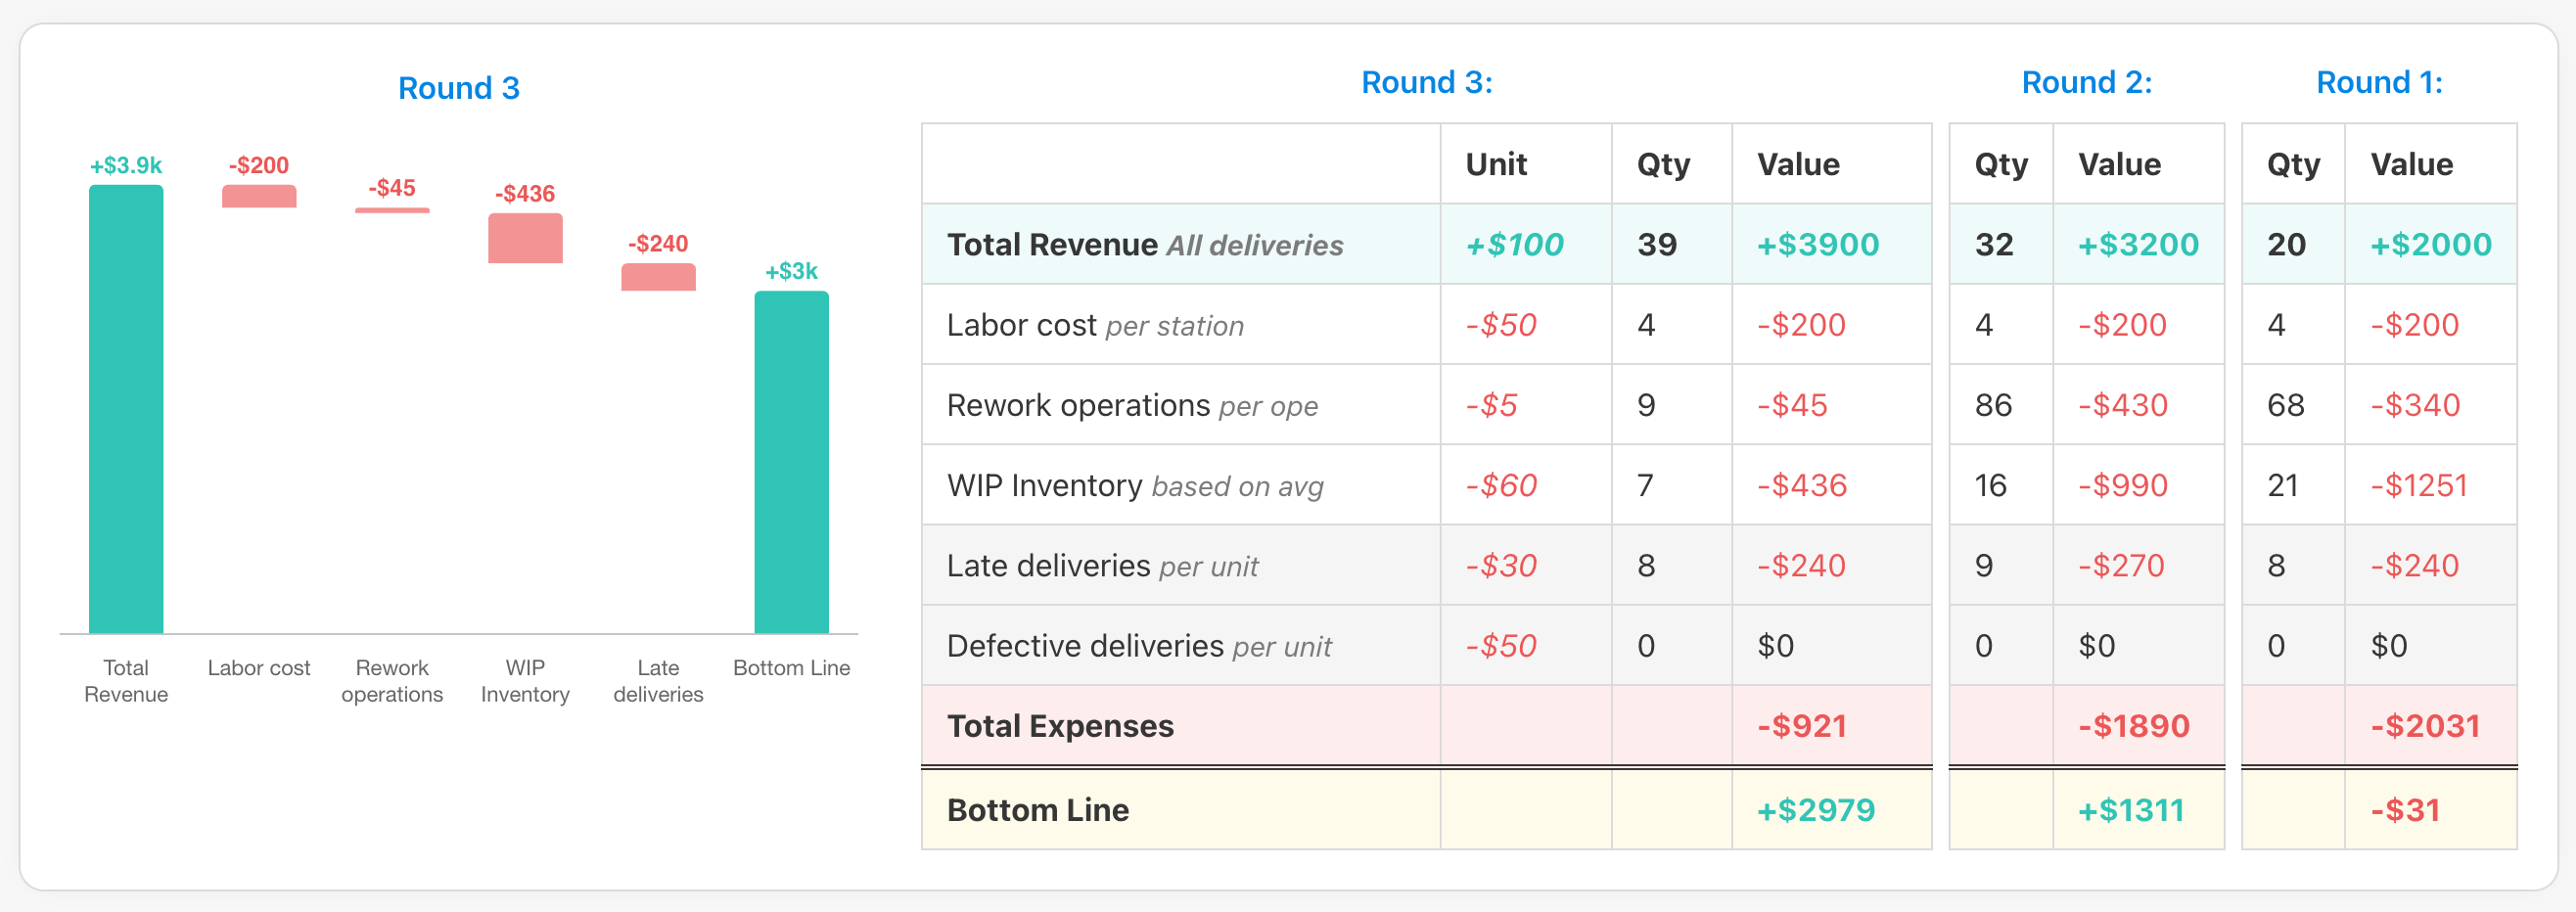
The waterfall is especially useful when comparing many teams/rounds — the shape of each chart tells the story before you read any numbers. A team with a tall WIP Inventory bar has a very different problem than one with a tall Rework bar, even if their bottom lines are similar.